I have recently been working with my father on expanding our family tree and adding information to individuals. One of the items he had was some annotated maps produced by his uncle showing the various pieces of property owned by the family in a small country town in NSW.
When I first saw these maps I immediately thought that it would be a good idea to have them overlayed onto a Google map to allow other members of the family to view them in context.
At the time, I had no idea of how to do this, but had seen the results on some other history websites. It was only when I watched the '
Map Your Business - Inside and Out' presentation from Google IO 2011 that I obtained the necessary knowledge and tools to produce these maps.
Although this presentation told me what tools were required to build the maps it was lacking in instructions on how to use the tools. I am hoping this blog post will provide a bit more guidance and some helpful hints on getting a result from these tools.
The general workflow for producing a map overlay from a hand-drawn or annotated map is:
- Obtain Source Maps
- Geo Reference the Source Maps
- Produce Overlay Tiles
- Build Page to display Overlap Map on Google Maps.
Obtain Source Maps
My source maps were hand-annotated maps that had been scanned as TIFF files. I resized these images and uploaded them to my hosting account. This was necessary to use the Overlay-Tiler tool in the next section. For the purposes of this tutorial I will use a historic map from Gosford, NSW.
Geo-reference the Source Maps
The first step to displaying these maps as overlays on Google Maps is to determine the latititude/longitude for the corners of the map. To make this easier, the Maps team from Google has provided a tool called Overlay-Tiler. This is an interactive map where you can drag the corners of a overlay image around until it lines up with the underlying Google Map. The output of this tool is a GDAL_TRANSLATE command line script which you can run against the image to produce a geo-referenced TIFF.
Step 1.
Open the
Overlay-Tiler web application in Chrome. The initial screen below allows you to specify the image location (published on web-site) and the initial location for the Google Map.
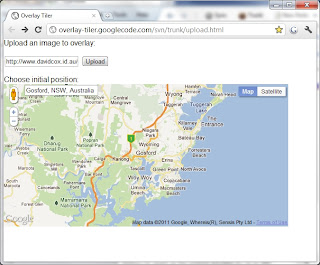 |
| Step 1 - Provide Overlay Image and Initial Location |
Step 2.
Pressing the Upload button will display the main screen for the Overlay-Tiler application. Your initial map will be displayed along with a semi-transparent overlay of your map image. This image is shown with control-points on three corners to allow you to drag and rotate the image to match the underlying Google Map.
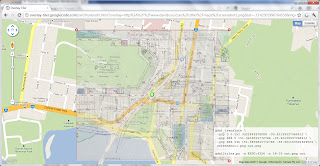 |
| Step 2 - Overlay Image displayed on Google Map |
Step 3.
By dragging the handles of overlay image and changing the zoom levels of the underlying Google Map it should be possible to line up major features of both maps. This can be quite time-consuming depending on the accuracy of the overlay map.
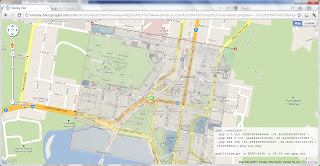 |
| Step 3. Overlay Map re-sized and rotated to line-up with Google Maps |
Step 4.
Once the overlay map has been aligned to the Google Map the GDAL_TRANSLATE command line will be displayed in the box in the bottom right-hand corner of the screen. Copy this command line to a safe place. I store these in the same directory as my maps.
The GDAL_TRANSLATE command line script will produce a new geo-referenced image. To run this command you will need to have the GDAL tools installed on your machine. Various versions of this toolset exist for most operating systems. I am using Windows so I downloaded and installed the desktop version of
OSGeo4W (Open Source GEO for Windows). This will install an environment on your machine to run GDAL tools.
Step 5.
To produce the geo-referenced image, start the OSGeo4W command prompt and copy the command line script from Step 4 above. The '\' characters will need to be removed from the command script.
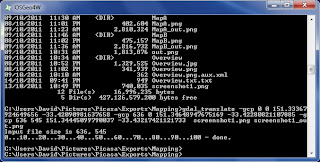 |
| Step 5 - Run the GDAL_TRANSLATE script to produce the geo-referenced image. |
The output from this section is a PNG image that includes embedded geo information.
Produce Map Tiles for your map
The final output from this process is a collection of tiles that can be referenced by the Google Maps API to overlay over the standard Google Maps tiles. A common way to produce these tiles is to use the GDAL2TILES Python script. This will produce a series of tiles that are named appropriately to publish and use in Google Maps API. As I do not currently have a Python environment installed I decided to use the MapTiler application which is a Graphical Interface to the GDAL2TILES script.
Step 1.
Run the MapTiler desktop application. Select the type of Tileset to create. We are creating a Google Map overlay so will select the first option.
Step 2.
Add a new Source Data file (Overlay Image created in the previous section). If the geo-referencing has occurred correctly, the Georeference column will show 'GCPs'.
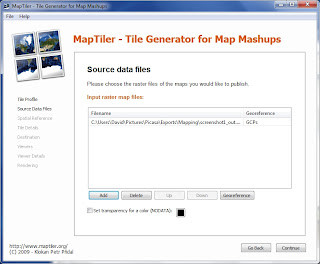 |
| Step 2 - Add a Source Data File |
Step 3.
Select a Spatial Reference System - for Google Maps overlays the most appropriate is WGS84.
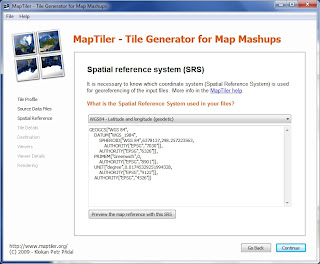 |
| Step 3 - Confirm the Spatial Reference System |
Step 4.
The next step in the MapTiler application is to select the Google Map zoom levels your overlay will be shown on. The application will default to the most appropriate zoom levels however you can adjust the levels to suit. The higher zoom levels will require a higher resolution image to avoid 'jaggies'.
You can also select the file format at this point.
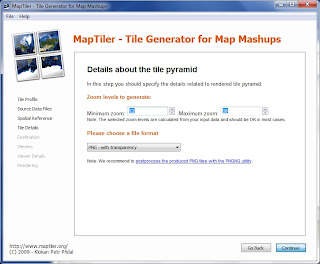 |
| Step 4 - Tile Pyramid |
Step 5
Enter the location where you would like the files to created.
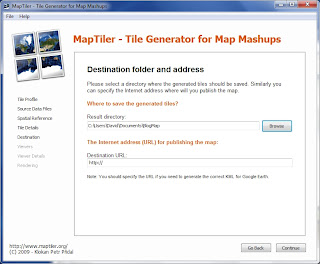 |
| Step 5 - File Location |
Step 6
Select the Web Viewers you would like MapTiler to generate. These are a HTML page that contains the appropriate code to display the overlay on either a Google Map or OpenLayers Map. These can be used as a base for your own pages.
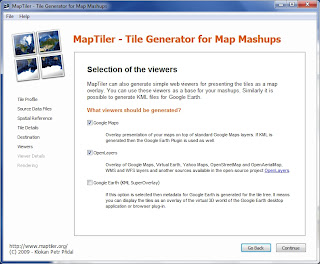 |
| Step 6 - Selection of Web Viewer |
Step 7
The next step in the process is to configure the Google Maps API Key. If you are testing only on your local machine you do not require a Maps API Key. If you want to publish on the web you will need to obtain a
Google Maps API Key. This key is restricted to a single domain.
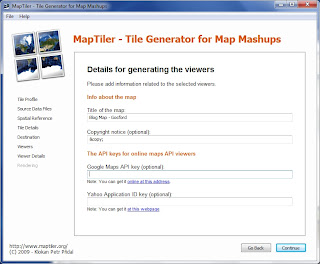 |
| Step 7 - Enter Google Maps API Key |
Step 8
The final step of the process is to Render the tiles. This will create a series of image tiles at each zoom level and the Map Viewer HTML.
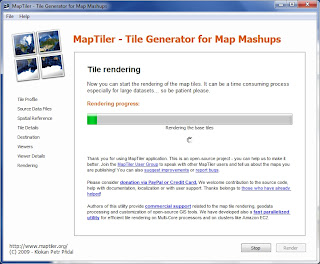 |
| Step 8 - Render the Tiles |
Publish your Map
The output from the MapTiler application is the collection of tiles (at various zoom levels) and one or two HTML Pages (depending on map options selected).
This directory structure can be copied directly to your web host, where it can be viewed as a full page map. Due to the simplicity of the HTML it is very strait-forward to modify the layout and contents of the page.
Conclusion
Using this technique to show overlay maps on Google Maps is a great way to show historic mapping in context of the current day. It also allows the overlay of other information (floor plans, evacuation maps)
The following examples show a Google Map and OpenLayers Map created as part of this tutorial.
Google Map Example
OpenLayers Example
I hope you find this tutorial useful. Feedback is always welcome.
Enjoy.


